

February 2022
A Dotty Plot with Irregular Behaviour
Christopher Redmond
Senior Cardiac Physiologist, Kingston Hospital NHS Foundation Trust
Disclosure: The author has no conflict of interests to declare.
Background
A 58-year-old patient with an implantable loop recorder, implanted to investigate episodes of unexplained syncope was admitted to A&E, following a pre-syncopal episode post dermatological surgery. Known arrhythmia history included a high ventricular ectopic burden and previously documented nocturnal bradycardia down to 35 bpm.
At the time of the episode the patient reported that they had suddenly felt dizzy and they had activated a symptom recording. They denied losing consciousness and were unaware of palpitations preceding or during the episode.
A remote monitoring transmission was received and reviewed by the remote monitoring team. The symptom episode displayed a 30 second ECG trace (30 seconds back from the activation time) and a heart rate interval dot plot displaying heart rate intervals in the eight minutes prior to the activation time. The full 8-minute ECG trace was not available to view.
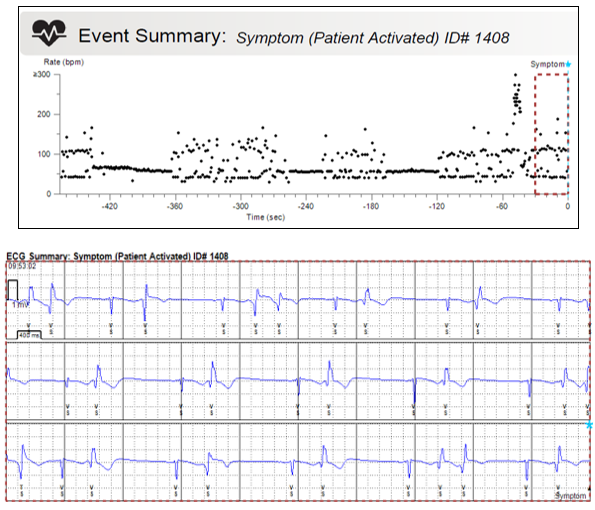
Figure 1: The heart rate dot plot for the event summary, time in seconds along the x axis, heart rate in beats per minute on the y axis. A single channel 30 second ECG trace displaying the heart rhythm in a 30 second window immediately prior to the symptom activation time.
QUESTION
From the dot plot and trace available, what was the most likely cause of the patient’s symptoms?
Answer
Non-sustained ventricular tachycardia
Explanation
On the far right of the plot there is a blue star indicating when the recording was activated (0s). What we see displayed is the heart rate dot plot showing heart rate intervals recorded in the eight-minutes prior to the symptom activation and a 30 second ECG strip immediately prior to the symptom activation (ECG available to view correlating with that seen within the broken line box).
On the left side of the plot at the start of the time interval there is a tramline appearance, with heart rate intervals being recorded at two separate rates, one at ~ 40 bpm the other at ~ 110 bpm. This appearance is typical of an atrial or ventricular bigeminy ECG pattern.
The rhythm then appears to stabilise at a heart rate of ~ 50-60 bpm which we would assume to be sinus rhythm, before starting to become more erratic. At the -360s time interval the heart rate intervals become irregular and don’t quite form the tram line appearance seen previously. This section of the plot looks similar to the section which has the 30 seconds of ECG available to view. We can see here that the plot corresponds to frequent ventricular ectopy seen as ventricular couplets and ventricular bigeminy.
Highlighted in figure 2 just prior to the symptom trigger there is a sudden rise in heart rate dots, recorded at rates of > 200 bpms. This episode which starts and stops abruptly lasts between 5-10 seconds.
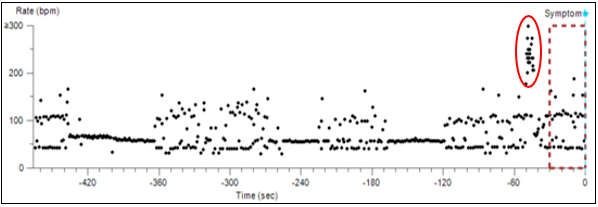
Figure 2: The heart rate dot plot from the event summary. Red circle indicates where there was a sudden brief increase in heart rate at an interval >200 bpm. 1b. 12 lead ECG with blue arrow highlighting non conducted atrial contractions hidden within the T wave. Red brackets demonstrating reset of the sinus node and subsequent non-compensatory pauses.
This subtle increase in rate indicates the occurrence of a tachycardic episode which was non-sustained. This arrhythmia is not seen on the ECG trace as it occurs ~50 seconds before the activation time. From the dot plot alone and from the choices available the most likely cause of the dizzy episode was a brief episode of non-sustained ventricular tachycardia.
Case outcome and learning points
A manual interrogation of the ILR was performed and the symptom episode examined. Frequent ventricular ectopy was seen with ectopics in isolation as couplet and in a bigeminal pattern (figure 3). The onset of the tachycardia episode was captured (figure 4) and displayed a true episode of non-sustained ventricular tachycardia which was deemed the cause of the patients’ symptoms. The patient was discussed with the local tertiary centre and was transferred for implantation of an implantable cardiac defibrillator.
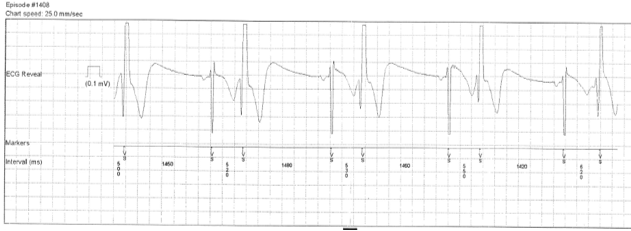
Figure 3: ILR ECG strip during the recorded symptomatic episode showing sinus rhythm with ventricular bigeminy.
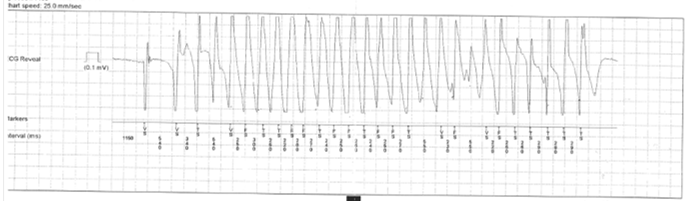
Figure 4: ILR ECG strip during the recorded symptomatic episode showing the onset of tachycardia and a true episode of non-sustained ventricular tachycardia.
Correlating symptoms with arrhythmias is important to ensure effective use of implantable loop recorders in clinical practice.
It is importance to thoroughly scrutinise all available information received on home monitoring transmission, specifically dot plots when analysing symptomatic events. Careful analysis of dot plots, intervals and review of subtle patterns, peaks and troughs is essential to help identify potential significant arrhythmias.
In this case the symptom transmission only displayed 30 seconds of ECG trace preceding the activation time. The tachycardic episode occurred 40-50 seconds prior to the activation time and was not available to view as an ECG in the transmission. This could have resulted in the episode not being seen or missed entirely until the patients next in clinic appointment. Analysis of the dot plot was essential at raising suspicion that further investigation was required and that an in-person transmission would help determine the best patient management.
References
- Medtronic REVEAL LINQTM LNQ11
Insertable Cardiac Monitor and Patient Assistant PA96000 Clinicians Manual: https://manuals.medtronic.com/content/dam/emanuals/crdm/M977359A001C_view.pdf