

August 2018
Remote alert for non-sustained RV oversensing episode
Matt Swift – Lead Cardiac Physiologist CRM
Great Western Hospital, Marlborough Road, Swindon, Wiltshire, SN3 6BB
matthew.swift2@nhs.net
with credit to Rob Williams from Abbott for assisting with the images
Background
A home monitoring transmission was received 9 months post implant for a 59-year-old male with an Abbott CRT-D. The transmission was sent due to an alert triggered for non-sustained RV oversensing, detected by the SecureSense algorithm on the device. An EGM from the transmission is displayed below.
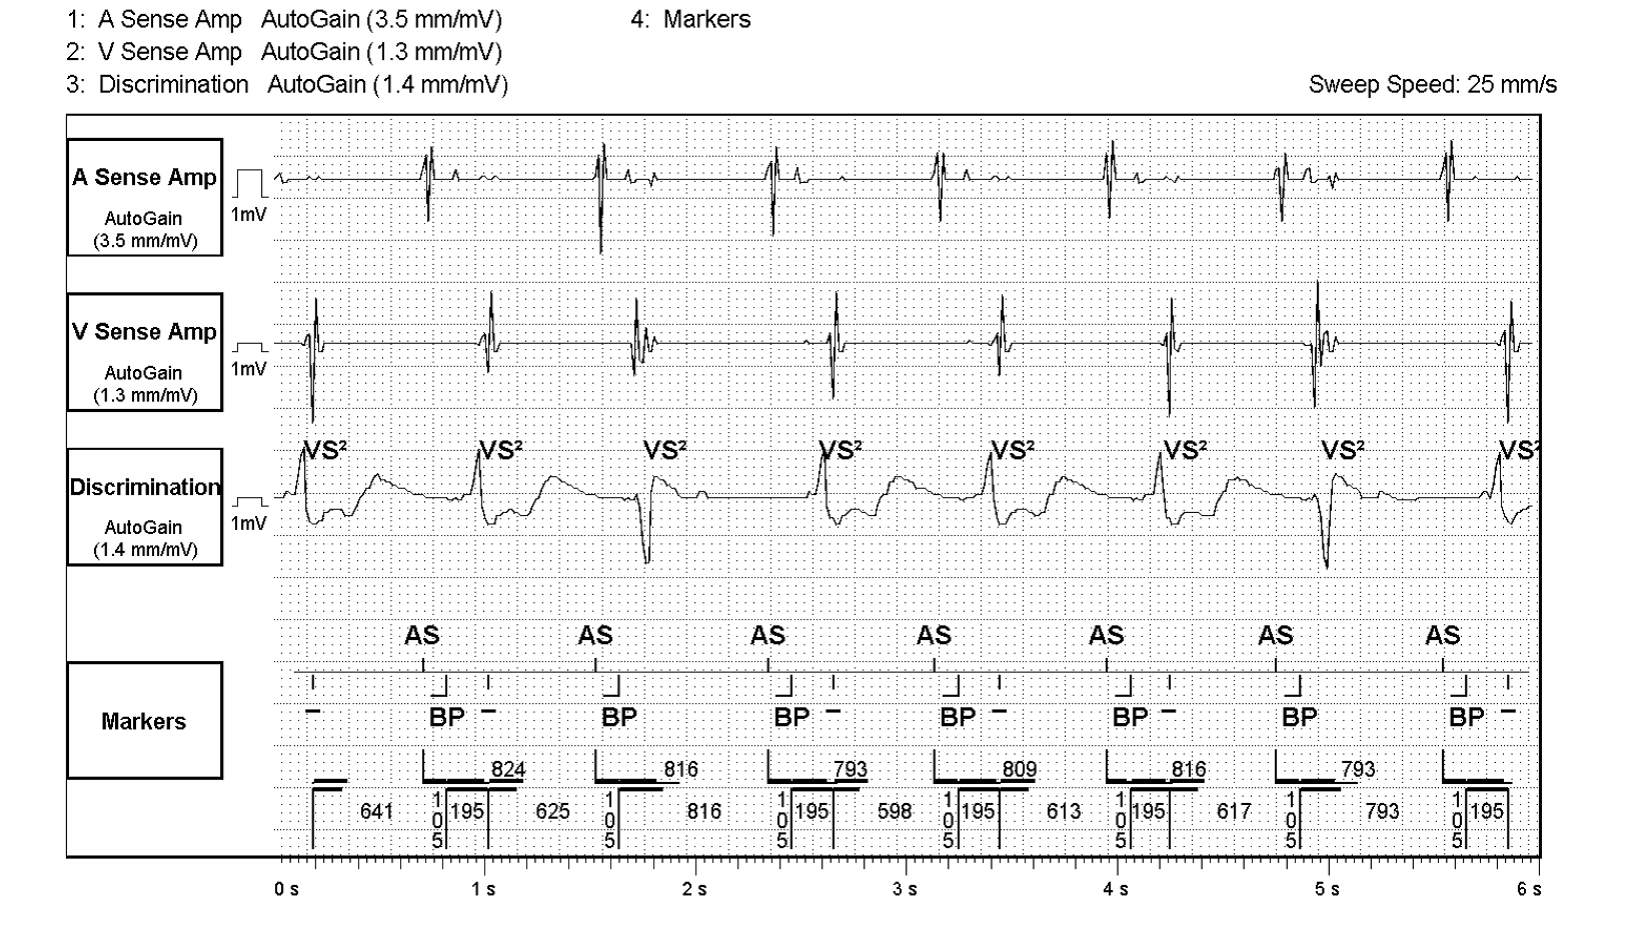

Figure 1
Stored electrogram of a non-sustained RV oversensing episode. Top to bottom, atrial electrogram, right ventricular near field electrogram, far field discrimination channel, marker channel.
THE QUESTION
What is behind the non-sustained RV oversensing episodes?
Answer
Intermittent loss of RV capture
Explanation
The EGM in figure 1 is an example of intermittent loss of RV capture which has been stored and detected as a non-sustained RV oversensing episode. The magnified trace in figure 2 shows a clear discrepancy between the RV near field and the FF discrimination channel EGMs. The trace shows an AS then BP marker. The BP marker is LV pacing being delivered first which is displayed on the FF (global) channel with depolarisation occurring with a slight delay. A further delay is seen until a deflection is seen on RV NF sense amplifier which is marked as a dash. If you look closely at the trace there are also clear differences in FF EGM morphologies with positive deflected complexes those with in essence LV only pacing and the negative deflected complexes true BP events (red circle)
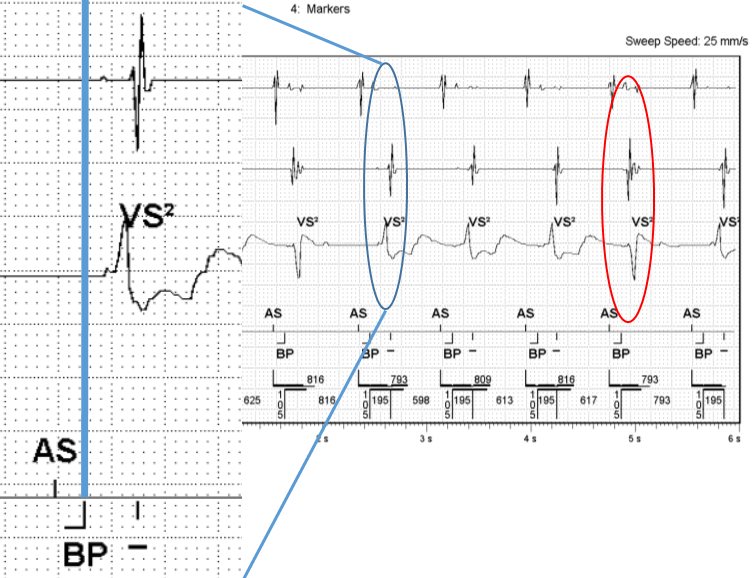

Figure 2
Magnified trace of figure 1 showing a clear discrepancy between RV NF and discrimination FF channels.
As for the other possible answers, clearly the device function is abnormal. The EGM does not display the type of artefact/noise seen with EMI or diaphragmatic myopotentials and the additional dash markers are not associated with the T waves seen on the FF channel.
Further case information
For this case as well as the triggered alert, other measurements and trends seen in the remote download supported the answer to the question and raised concerns over the RV lead integrity. The RV cap confirm measurement was higher than the previous in clinic measurement. The RV Cap confirm trend shows a gradual rise in RV threshold over the last year and the RV lead impedance trend shows a gradual decrease in impedance over time with the impedance dropping below 290 ohms suggesting possible lead insulation damage.
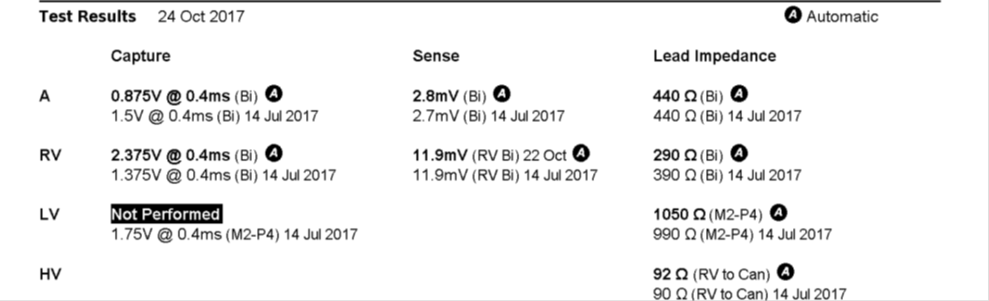

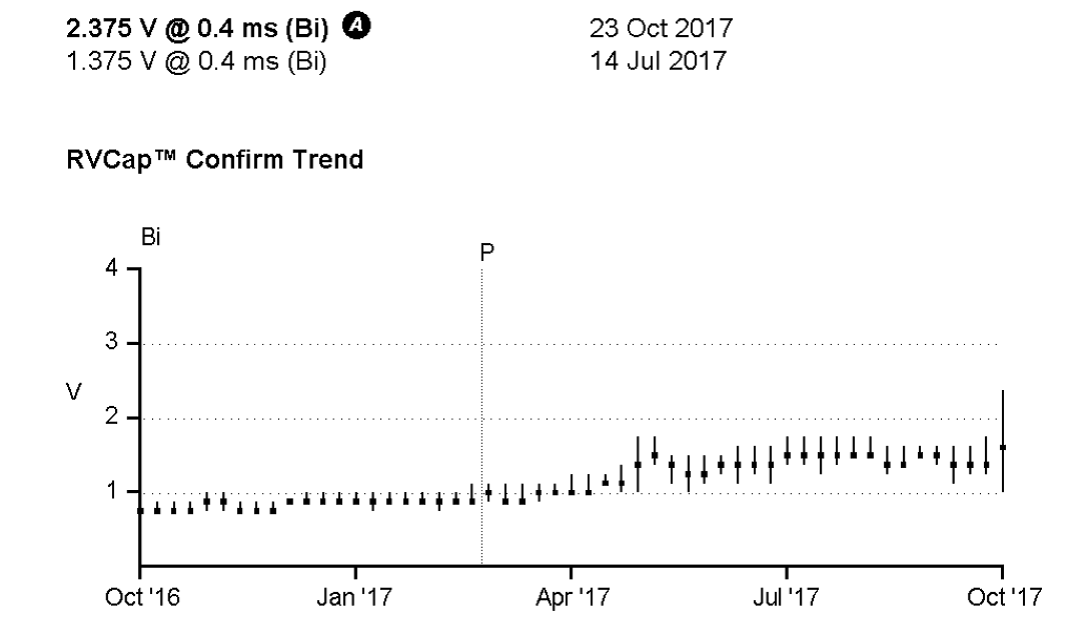
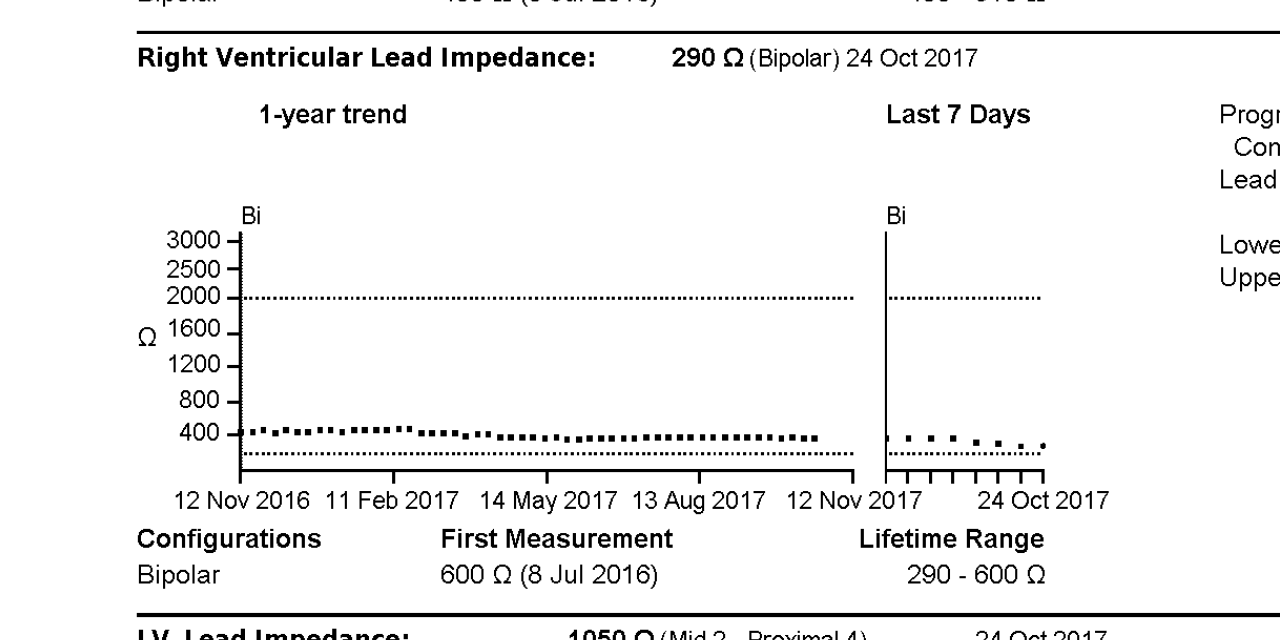
Figure 3
Top image shows atrial, RV and LV capture, sense and lead impedance measurements. Middle image shows the RV Cap confirm trend for the last year showing a gradual rise in RV threshold over time. Bottom image shows the RV lead impedance trend for the last year which shows a gradual decrease in measured impedance which started up at 600 ohms and has now dipped under 300 ohms.
When the patient attended clinic for review following the home monitoring alert the RV capture threshold was found to be intermittent, below 4.5 volts at 1.5 ms. The lead was extracted a few days later and a new lead was implanted with no further issues seen to date.